
 Course overview
The course aims to develop knowledge and skills on how to present information in an understandable, efficient, effective, and aesthetic manner for the purpose of explaining ideas and analysing data. The course further aims to develop skills at designing and evaluating information visualizations and other forms of visual presentation. Finally, the course aims to build familiarity with core principles and some of the literature of the field.
Participants in piloting
This is the 2nd semester core course offered in the M.Sc. in Computer Engineering Specialization in Data Science and Analytics program of the Department of Electronics and Computer Engineering, Pulchowk Campus, IOE, Tribhuvan University. 20 students are typically enrolled in the course each academic year.
Use of ALIEN services and tools
Students were divided into groups of 5 individuals. Each group was assigned a mini-project. The focus on the mini-project was to develop an information visualization application on a specific topic and dataset. A sample project was to develop a system for information visualization and analysis student results in semester exams.
Each group of students collected and reviewed material on the web and campus intranet. Students also downloaded necessary datasets and tools from the internet. They studied the datasets and proposed a visualization solution. Students presented their suggested solutions and received feedback from their peers and the instructor. Subsequently, groups developed a solution prototype and demonstrated it to other groups, the instructor, and invited guests.
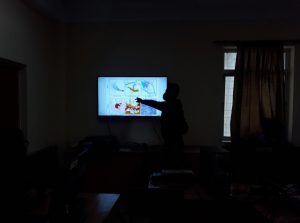
The activity took place in the ALIEN problem-based learning lab, which includes workstations, projectors, and internet support. Students used software tools such as Microsoft® Powerpoint for delivering presentations. They further used information visualization software packages. Students used reference material and datasets from the internet as well as books on information visualization from the university library.


In the beginning of the course the students used workstations and lab connectivity to explore sources and collect required data and documents. They downloaded the material from the internet and proposed and proposed a solution to the assigned problem. Students presented their idea to the class and received feedback by the instructor, their peers, and the domain expert. Subsequently, students setup the required software development environment on the computers for developing the software code required for information visualization. Students demonstrated their final solutions upon completing the activity. The presentations were used as the basis for student evaluation.